This is a course assignment for analyze and visualize earthquake data
1. Read the data in and clean it for analysis, used the readr package functions for reading and parsing data. [5 marks]
My answer is written here and is explains what I did and why.
    #code
    library(tidyverse)

    ## ── Attaching packages ─────────────────────────────────────── tidyverse 1.3.2 ──
    ## ✔ ggplot2 3.4.0      ✔ purrr   1.0.0
    ## ✔ tibble  3.1.8      ✔ dplyr   1.0.10
    ## ✔ tidyr   1.2.1      ✔ stringr 1.5.0
    ## ✔ readr   2.1.3      ✔ forcats 0.5.2
    ## ── Conflicts ────────────────────────────────────────── tidyverse_conflicts() ──
    ## ✖ dplyr::filter() masks stats::filter()
    ## ✖ dplyr::lag()    masks stats::lag()

    #read data
    data <- read_csv("https://jjvenky.github.io/GG606AW23/database.csv",
                     col_types = cols(Date = col_date(format = "%m/%d/%Y"),
                                      Time = col_time(format = "%H:%M:%S")))
    #problems(data)
    #data[problems(data)$row,]
    #as.POSIXct(problems(data)$actual, "%Y-%m-%dT%H:%M:%S", tz="UTC")

    #check data and omit N/A
    if(any(is.na(data$Date))){
      data <- filter(data, !is.na(data$Date))
    }
    data
## # A tibble: 23,409 × 21
## Date Time Latitude Longitude Type Depth Depth…¹ Depth…² Magni…³
## <date> <time> <dbl> <dbl> <chr> <dbl> <dbl> <dbl> <dbl>
## 1 1965-01-02 13:44:18 19.2 146. Earthqu… 132. NA NA 6
## 2 1965-01-04 11:29:49 1.86 127. Earthqu… 80 NA NA 5.8
## 3 1965-01-05 18:05:58 -20.6 -174. Earthqu… 20 NA NA 6.2
## 4 1965-01-08 18:49:43 -59.1 -23.6 Earthqu… 15 NA NA 5.8
## 5 1965-01-09 13:32:50 11.9 126. Earthqu… 15 NA NA 5.8
## 6 1965-01-10 13:36:32 -13.4 167. Earthqu… 35 NA NA 6.7
## 7 1965-01-12 13:32:25 27.4 87.9 Earthqu… 20 NA NA 5.9
## 8 1965-01-15 23:17:42 -13.3 166. Earthqu… 35 NA NA 6
## 9 1965-01-16 11:32:37 -56.5 -27.0 Earthqu… 95 NA NA 6
## 10 1965-01-17 10:43:17 -24.6 178. Earthqu… 565 NA NA 5.8
## # … with 23,399 more rows, 12 more variables: `Magnitude Type` <chr>,
## # `Magnitude Error` <dbl>, `Magnitude Seismic Stations` <dbl>,
## # `Azimuthal Gap` <dbl>, `Horizontal Distance` <dbl>,
## # `Horizontal Error` <dbl>, `Root Mean Square` <dbl>, ID <chr>, Source <chr>,
## # `Location Source` <chr>, `Magnitude Source` <chr>, Status <chr>, and
## # abbreviated variable names ¹`Depth Error`, ²`Depth Seismic Stations`,
## # ³Magnitude
Here col_types in read_csv function was defined with format to
match the format of Date and Time in the .csv file.
Note:
There are 3 rows in which the Date and Time were written different
format compared with the rest of the dataset. Although it’s possible to
convert them to acessible format, for example using
as.POSIXct(problems(data)$actual, "%Y-%m-%dT%H:%M:%S", tz="UTC").The
current method somehow could successfully return the correct Date, and
the following question doesn’t necessary need the exact time of the
earthquakes, plus I’m not sure about the timezone in the Date written
in those 3 rows. So I just ignored those 3 rows as this warning would
not affect following analysis.
2. Did more earthquakes happen on weekends or weekdays? [5 marks]
    #code
    #select Earthquake
    Earthquake <- subset(data, Type == "Earthquake")
    #convert Date to day in a week
    Earthquake$wday <- weekdays(Earthquake$Date)
    #reorder days in week (so it'll be in good order in figure's legend)
    Earthquake$wday <- factor(Earthquake$wday,
                              levels = c("Monday","Tuesday","Wednesday","Thursday",
                                         "Friday","Saturday","Sunday"))
    #separate weekdays and weekend
    Earthquake <- mutate(Earthquake,
                         wday_ID = case_when(wday == "Sunday" ~ "Weekends",
                                             wday == "Saturday" ~ "Weekends",
                                             TRUE ~ "Weekdays"))
    #check dataset before plotting
    #Earthquake

    #plot
    ggplot(data = Earthquake) +
      geom_bar(aes(wday_ID,fill=wday), alpha=1) +
      theme_classic() + scale_fill_brewer(palette = "Set3") +
      labs(title = "Amount of Earthquake happened on Weekdays and Weekends",
           x="",fill="Day in week")

The above analysis demonstrates the amount of earthquakes happened on weekdays and weekends in the dataset. There are significantly more earthquakes happened on weekdays, however, when it comes to the number of earthquakes per day, it doesn’t show any preference between weekdays or weekends. There are 5 days in a week could be counted as weekdays, while only 2 days are weekends. If earthquakes are equally distributed in every day, then when numbers added up, it will be more earthquakes on weekdays than weekends as there are more days in weekdays.
3. Has there been any change in the frequency of earthquakes? [5 marks]
    #code
    #create new variable Year
    Earthquake <- mutate(Earthquake, Year = format(Date, "%Y"))

    #(for setting figure axis)
    #count minmax of Year and number of earthquakes
    minyear <- min(Earthquake$Year)
    maxyear <- max(Earthquake$Year)
    counteq <- Earthquake %>% count(Earthquake$Year)
    maxeq <- max(counteq$n)
    maxy <- ceiling(maxeq/100)*100

    #plot
    ggplot(data = Earthquake) + geom_bar(aes(Year),fill="cornflowerblue") +
      theme_minimal() + scale_fill_brewer(palette = "Set3") +
      labs(title = paste0("Amount of earthquake each year (", minyear,
                            "-", maxyear, ")")) +
      scale_x_discrete(breaks = seq(minyear,maxyear,by=5)) +
      scale_y_continuous(breaks = seq(0,maxy,by=100), expand = c(0,0)) +
      coord_cartesian(ylim = c(0,maxy))

The above analysis demonstrates the trend of earthquake from 1965 to 2016. The number of earthquake in each year showed a steady increase in the given time period. Therefore, we concluded that the frequency of earthquake in each year has a steady increase between the year of 1965 and 2016.
4. Where were there more earthquakes in the 1980s, South America or North America? [5 marks]
    #code
    library(maps)
##
## Attaching package: 'maps'

## The following object is masked from 'package:purrr':
##
##     map
    #select earthquakes in 1980s
    eq.1980s <- filter(Earthquake, Year >= 1980 & Year <= 1989)
    #eq.1980s

    #First, plot a scatterplot map with all the earthquakes in 1980s
    world_map <- map_data("world")
    ggplot(NULL) +
      geom_polygon(data = world_map, aes(x=long,y=lat,group=group),
                   fill="azure3") +
      geom_point(data = eq.1980s, aes(x=Longitude, y=Latitude),
                 color = "cornflowerblue", size=.5) +
      theme_void() +
      ggtitle("Earthquakes in 1980s")

    ## Notice a lot of earthquakes located in ocean, some on land
    ##define South/North America

    ##only count earthquakes happened on land
    ##convert (lat,lon) to continent (point in polygon question)
    ##https://stackoverflow.com/questions/21708488/get-country-and-continent-from-longitude-and-latitude-point-in-r
    library(sp)
    library(rworldmap)
## ### Welcome to rworldmap ###

## For a short introduction type :   vignette('rworldmap')
    latlon2Con <- function(lat,lon){
      sPDF <- getMap()
      points = data.frame(lon=lon,lat=lat)
      pointsSP = SpatialPoints(points, proj4string = CRS(proj4string(sPDF)))
      indices = over(pointsSP, sPDF)
      return(indices$REGION)
      #return(indice$ADMIN)
    }
    eq.1980s.land <- mutate(eq.1980s,
                       Continent = latlon2Con(eq.1980s$Latitude,eq.1980s$Longitude))
    eq.1980s.land <- filter(eq.1980s.land, !is.na(Continent))
    ggplot(data = eq.1980s.land) +geom_bar(aes(Continent), fill="cornflowerblue")+
      theme_classic() + ggtitle("Earthquakes in 1980s (on land)")

    ##2. consider earthquakes both on land and ocean
    ##if earthquake located in ocean, find the nearest continent
    ##calculate centriods of each countries
    #library(sf)
    #world_map_sf <- st_as_sf(world_map, coords = c("long","lat"), crs=4326)
    #crs = 4326 means lat lon are interpreted as WGS 84 coordinates
    #world_cens <- st_centroid(world_map_sf)
    #create index to speed up the nearest function
    #grid_index <- st_make_grid(world_cens)
    #find nearest centroids
    #point <- data.frame(lon=100,lat=23)
    #point_sf <- st_as_sf(point, coords = c("lon","lat"), crs=4326,agr="contant")
    #nearest_points <- st_nearest_points(world_cens,point_sf,index=grid_index)
    #still takes too much time and memory, ignore this method!
    #nearest_points
The above analysis demonstrates the geospatial distribution of earthquakes in 1980s and the number of earthquake in each continent.
First, I demonstrated the raw data of earthquakes in 1980s and their distribution. The earthquakes were mostly taken place in the major earthquake zone, while some of the earthquakes happened on land, a large number of them happened in the ocean area. Here, when identifying the origin location(continent) of earthquakes, I excluded those in the ocean.
Idealy, there should be 2 algorithms identifying the origin location of
the earthquakes: point-in-polygon and finding-nearest-points. After
experiments, I realized it’s not feasible to calculate nearest points
using such large dataset on my laptop. Here I modified the function in
rworldmap package and in this
solution.
The latlon2Con function in the code could decide whether the location
(indexed by latitude and longitude) falls into a certain country’s
polygon, and return the continent where that country belongs. However,
for earthquakes happened in ocean, it will return N/A value.
With the above function, we can assigned a Continent value for each
earthquakes on land in 1980s, and plot and bar plot indicating the
number of earthquakes on each continent in 1980s. Here thh bar plot
shows that there are more earthquakes in South America than North
America in 1980s.
5. Has there been any geographic shifts in the distribution of earthquakes? [10 marks]
    #code
    eq.land <- mutate(Earthquake, Continent =
                        latlon2Con(Earthquake$Latitude,Earthquake$Longitude))
    eq.land <- filter(eq.land, !is.na(Continent))

    eq.land.num <- eq.land %>% count(Year, Continent) %>% group_by(Continent)

    ggplot(eq.land.num, aes(x=Year, y=Continent, fill=n)) +
      geom_tile() + theme_classic() +
      labs(title = paste0("Earthquakes on land (", minyear,
                            "-", maxyear, ")"),fill="Num") +
      scale_x_discrete(breaks = seq(minyear,maxyear,by=5)) +
      scale_y_discrete(expand = c(0,0)) +
      scale_fill_distiller(palette = "YlOrRd", direction = 1)
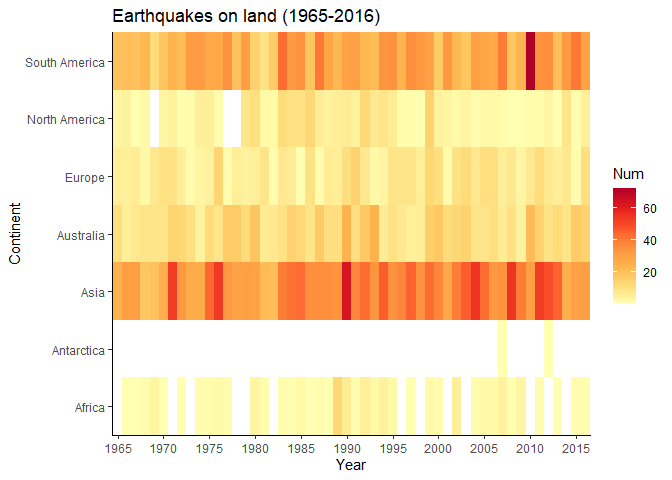
The above analysis demonstrates the number of earthquakes in each continent from the year of 1965 to 2016. Similarly, here I only considered earthquakes happened on land, using the same function as in the previous question. According to the figure, there is no major shifts of the location(origin continent) of earthquakes in the given time period. Asia and South America constantly have more earthquakes compared to other continents.
6. Comment on how lessons from Wilke’s Fundementals of Data Visualization were applied to each figure with specific reference to book sections [5 marks]
Overall, I tried to produce clean and readable figure, with clear coordinates and readable titles, legends and axis.
-
For the figure illustrating the number of earthquakes on weekdays and weekends: It is a figure to visualize amounts, I chose stacked bar plots. In this way, the figure could display the amount of earthquakes in weekdays and weekend while comparing earthquakes happened in each day, showing more information at the same time. I also assigned an order to the weekdays column so that it will displayed in a more readable way (i.e. following the order of day in a week). Reference: Section 6.2
-
For the third question, I displayed the amount of earthquakes each year to visualize how the frequency of earthquakes (in each year) changed in the given time period. Similar to the second question, here I also visualized the amount, but with more data points. Another potential way is visualizing the trends with smoothed line plot, however, I want readers have a clearer sense of specific numbers without omitting too much information, so I still used the bar plot. This time, in order to give a clearer reference of numbers, I changed to
theme_minimal()to display hidden grid lines on the figure. This design will allow readers locate the values of each bar easier while still maintain a clear visualization style. Reference: Section 25, Section 28.3 -
For the 4th question, I used 2 figures:
-
Global distribution of earthquakes in 1980s.
-
Although it is not directly asked, for question involved with further analysis, I prefer to offer the raw data first. This will give reader (and myself) a more general idea of the data, and avoid future misunderstanding or mistakes when further analysis the data. Here, I displayed the raw distribution of earthquakes globally, showing some general knowledge of where the earthquakes usually take place, and leads to further discussion that lots of earthquakes happened in the ocean area, while I only consider earthquakes on land in the following analysis. This will also avoid future questions from readers e.g. why the number of earthquakes counted in the next figure is much smaller compared to the numbers shown in the 2nd and 3rd question.
-
Here I used
theme_void()to only display the global landmass and earthquakes location. The color of landmass and earthquakes were carefully chose so that it can clearly distinguish earthquakes from landmass. It might be better to use Robinson Projections so that the high latitude area is less distorted, but I have problems finding this projection incoord_map(), besides we are not focused on high latitude in this question, so I used the default settings. Reference: Section 4.1
-
-
Number of earthquakes on each continents. Here it’s also required to display “amounts”, so I used the simple bar plots to make the figure clear.
- For the 5th question, I used a heatmap to illustrate how the number of earthquakes changes on each continent in each year. If there was geographic shift, say, from continent to continent, then it would be easily spotted on the heatmap figure. Besides, I also selected color palette to make the fill colors represent the number values in a more custom way. Reference: Section 6.3, Section 4.2